|
Selection of Sound Silencers
The selection of a silencer can best be demonstrated
by using an example. The method can be used irrespective of whether
a cylindrical silencer, rectangular silencer or an enclosure needs
to be dimensioned.
Specification
A discharge attenuator is required to reduce fan noise to 85 dB(A)
at 1 metre.
The Oktavband values of the fan are*:
| Oktavband Hz |
64 |
125 |
250 |
500 |
1k |
2k |
4k |
8k |
| Sound Power Level |
108 |
108 |
109 |
115 |
106 |
105 |
100 |
95 |
Volume flow rate is 0,97 m3/s
Maximum pressure loss through attenuator to be 125 Pa (N/m2)
* From Sound calculation, e. g. from Witt & Sohn
Fan Selection Programm
Step 1
Determine the attenuator insertion loss from
SWL and target noise level
| Oktavband |
Hz |
63 |
125 |
250 |
500 |
1K |
2K |
4K |
8K |
|
| Fan Sound Pressure Level |
dB |
108 |
108 |
109 |
115 |
106 |
105 |
100 |
95 |
(1) |
| A´wtg |
dB |
-26 |
-16 |
-9 |
-3 |
0 |
+1 |
+1 |
-1 |
(2) |
| SPL @ 1m |
dB |
-8 |
-8 |
-8 |
-8 |
-8 |
-8 |
-8 |
-8 |
*(3) |
| Target 85 dB(A)** |
dB |
-80 |
-80 |
-80 |
-80 |
-80 |
-80 |
-80 |
-80 |
**(4) |
| Approx. Attenuator insertion loss |
dB |
- |
4 |
12 |
24 |
18 |
18 |
13 |
6 |
(1)+(2+3+4) |
* Assumes free field conditions (no reflections
from the wall) over a hemisphere
** As a guideline: 5 dB less than the target noise level in each
oktavband
Step 2
Select attenuator to achieve the required
insertion loss
From the attenuator insertion loss tables select an attenuator
that has an insertion loss equal to or greater than the required
insertion loss in each octave. In this example, the attenuator
type 364 has an insertion loss that closely matches the required
insertion losses.
|
| Oktavband |
Hz |
64 |
125 |
250 |
500 |
1k |
2k |
4k |
8k |
| Required l. Loss |
dB |
- |
4 |
12 |
24 |
18 |
18 |
13 |
6 |
| Insertion loss of type 364 |
dB |
5 |
8 |
16 |
24 |
29 |
26 |
18 |
16 |
Step 3
Checking that the attenuator insertion
loss meets the target noise level
| Oktavband |
Hz |
64 |
125 |
250 |
500 |
1k |
2k |
4k |
8k |
| Fan Sound Pressure Level |
dB |
108 |
108 |
109 |
115 |
106 |
105 |
100 |
95 |
| A´wtg |
dB |
-26 |
-16 |
-9 |
-3 |
0 |
+1 |
+1 |
-1 |
| SPL @ 1m |
dB |
-8 |
-8 |
-8 |
-8 |
-8 |
-8 |
-8 |
-8 |
| Insertion Loss |
dB |
-5 |
-8 |
-16 |
-24 |
-29 |
-26 |
-18 |
-16 |
| A´wtd SPL @ 1m |
dB |
69 |
76 |
76 |
80 |
69 |
72 |
75 |
70 |
Total by normal DB addition = 84 dB(A)
|
 |
 |
Step 4
Determine attenuator cross section to meet
the pressure loss requirement
A maximum of 125 Pa pressure loss was specified.
The 'K' factor from attenuator insertion loss tabe - for 364 it
is 5.9. From the rectangular attenuator pressure loss graph follow
the diagonal 'K' factor line equivalent to 5.9 till it meets the
125 N/m² (horizontal) pressure drop line. From this point go vertically
down the graph to the attenuator face velocity in m/sec. In this
example, 5.8 m/sec. An attenuator cross section can now be calculated
from the required face velocity of 5.8 m/sec and the air volume
at 0,97 m3/sec. The (minimum) cross-sectional
area in this example is therfore 0,97/58%nbsp;m2 = 0,167 m2.
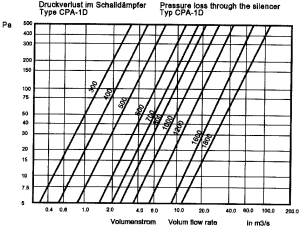
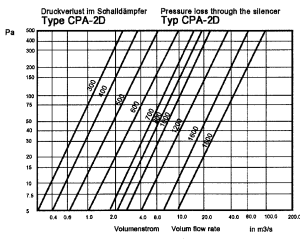
For a cylindrical attenuator this can be seen
directely for the graphs for CPA-1/CPA-2D below.
|

